
Published on: December 15, 2021 Updated 2 times since publishing
The state of safety in America is something that’s talked about often. It’s no secret that the US has fallen victim to some of the worst crimes in the world, whether mass shootings or murders.
So, where are the safest places in the country? Which cities have the highest crime rates? How do you know if the city you live in is on the dangerous list?
We delved deep into the latest trends and statistics about safety in the US to get those answers. We’ve uncovered the top 10 safest and unsafest cities, plus looked at which crimes are increasing and decreasing, and how certain demographics can affect the safety of cities.
Here’s everything you need to know about the state of safety in the US, including how things have changed (and in some cases worsened) over the years.
The State of Safety & Crime in the US
Crime is an issue for all countries around the world, but the US holds the record for some of the highest crime rates globally. Despite crime rates steadily decreasing over the past few decades, numbers remain high, particularly across certain genders and age groups.
1. The US Has More Prisoners Than Any Other Country
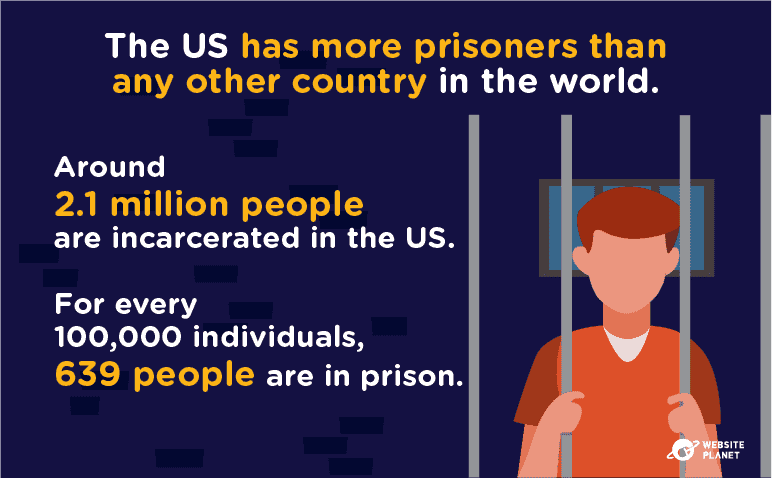
As of July 2021, the US has more prisoners than any other country worldwide, with nearly 2.1 million incarcerated individuals. China is second in line, but by comparison, it has 1.7 million incarcerated individuals — a difference of 0.4 million.
For every 100,000 individuals, the US has around 639 prisoners, which is the highest of any country globally. And some states are more affected than others, with Texas holding the highest number of prisoners at over 150,000 individuals.
2. Violent Crime in the US Stands High

Violent crime in the US has decreased considerably in the last 2 decades, though rates are still high. In 2019, the total number of violent crimes committed was 1.2 million — a decrease of around 100,000 from 10 years ago.
Per 100,000 people, that equates to 366 individuals responsible for violent crime. The most common offenses are rape and sexual assault, murder, robbery, and aggravated assault.
3. Young Adults Are Most Likely to Commit & Fall Victim to Crime
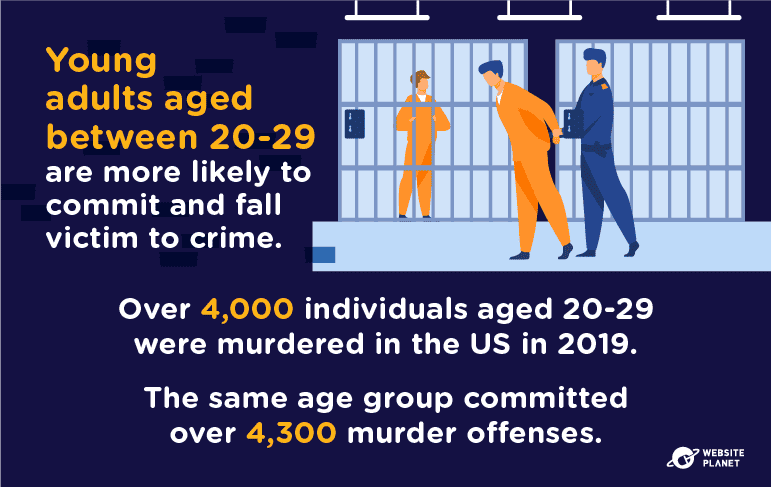
Young adults aged between 20-29 are much more likely to commit and fall victim to crime than any other age group.
In 2019, over 4,000 individuals aged 20-29 were murdered in the US. The same age group committed over 4,300 known murder offenses, but this fell to around 2,000 in the next age category, 30-39.
4. Most Offenders Are Male
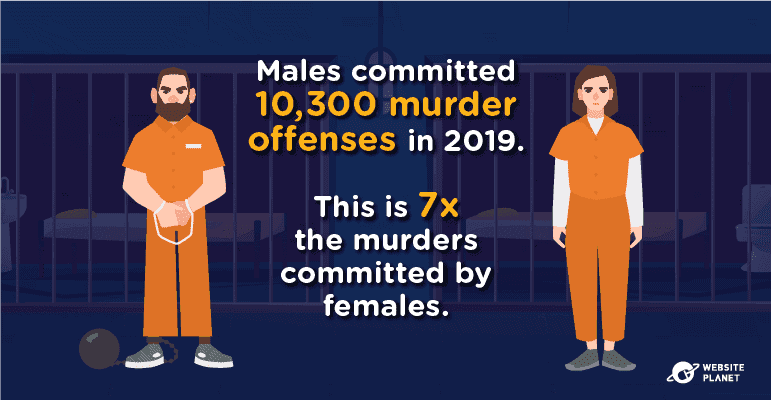
Gender also has a part to play in patterns between offenders.
Most offenses are committed by males, with around 10,300 murder offenses in the US in 2019. This is more than 7 times the amount of females, which was 1,400 in 2019.
However, many offenses are also committed by individuals whose gender is unknown. This category was responsible for over 4,500 homicides in 2019.
5. Most Victims Are Black Males
The number of Black victims has dropped steadily over recent years, but crime patterns among this race and gender are still very apparent.
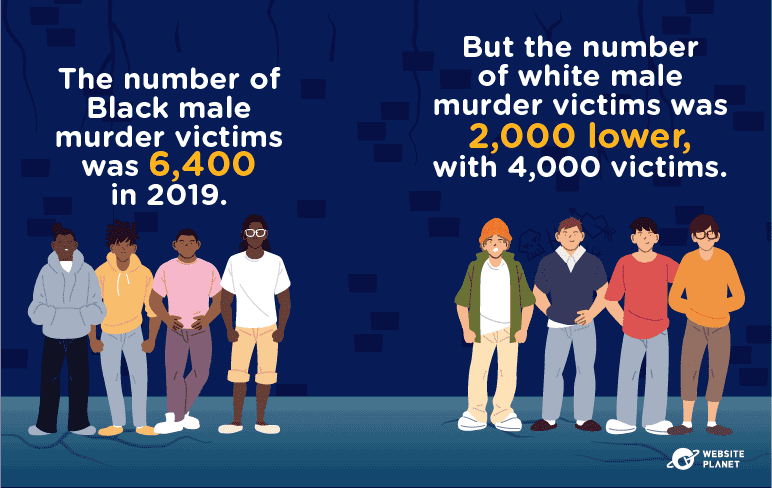
In 2019, the number of murder victims that were Black males was around 6,400. However, the number of white males also murdered was estimated to be 2,000 lower, at 4,000, in the same year.
In fact, Black males are twice as likely to fall victim to gun violence and death than white males. This particularly applies to those with socio-emotional influences, highlighting the impact that factors such as poverty, education, and unemployment have on crime rates.
6. Some Cities Experience More Violent Crime Than Others
The distribution of crime across US cities is not linear. Some states and cities experience much higher crime rates than others, with these states typically being marked more dangerous.
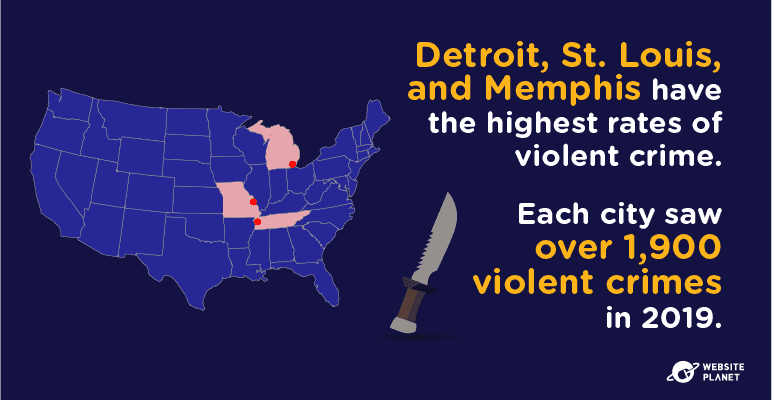
Detroit, St. Louis, and Memphis have the highest number of committed violent crimes, with over 1,900 violent crimes per city. These typically include manslaughter, forcible rape, robbery, and aggravated assault.
Baltimore and Cleveland also have high rates of violent crime. Both cities experienced over 3,300 violent crimes combined in 2019.
7. Property Crime in the US Remains a Problem

Similar to violent crime, the number of property crimes in the US has dropped over the last few decades — but rates remain high compared to other countries worldwide.
The number of reported property crimes in the US to date stands at 6.92 million, which equates to 2,100 offenders for every 100,00 people.
Among property crimes, larceny-theft is the most common, with over 5 million reported cases in 2019 alone.
8. The US States With the Highest Rates of Property Crime
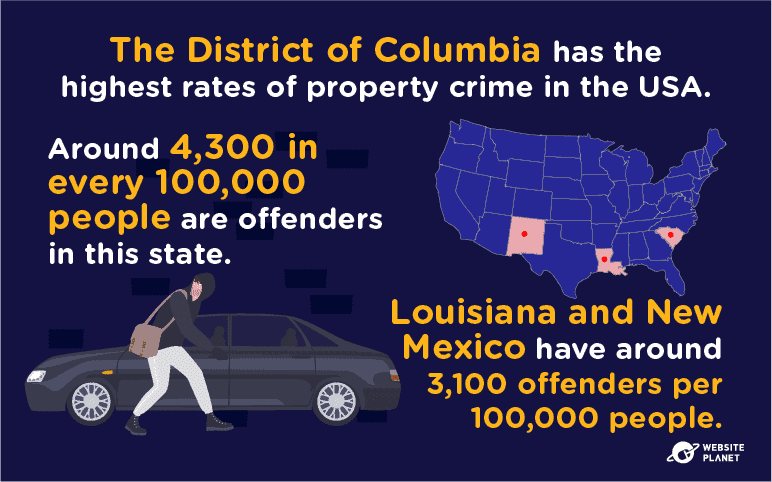
Overall, the District of Columbia has the highest rate of property crime compared to all other US states. Around 4,300 in every 100,000 people are likely to be offenders.
Louisiana and New Mexico are also in the top 3 states with the highest property crime rates, with around 3,100 offenders per state. However, in safer cities, the property crime rate drops to about 1,000 for every 100,000 inhabitants.
9. Safer Cities Have Lower Than Average Crime Rates
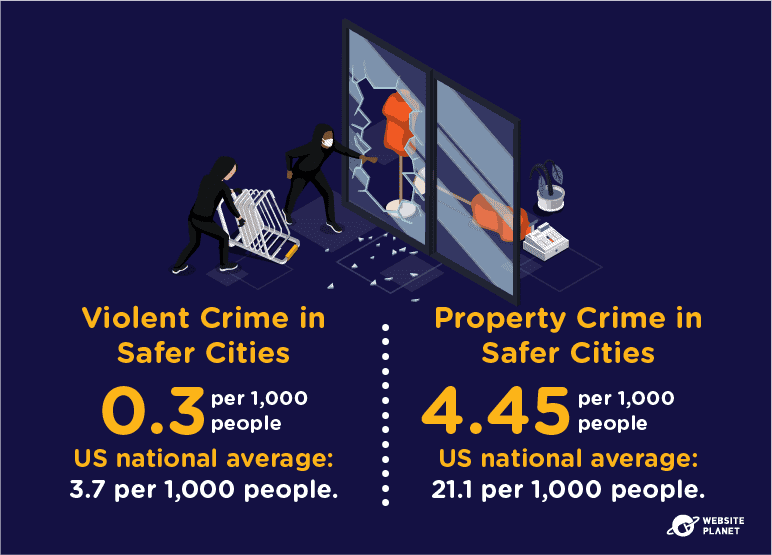
In safer cities, the violent crime rate is 12.33 times lower than the US national average. The top 100 safer cities typically have a violent crime rate of 0.3 per 1,000 people, compared to a national average of 3.7.
This is also true for property crime. Safer cities see 4.45 offenders per 1,000 people, while the national US average stands at 21.1.
10. Income Is Much Lower in Cities With Higher Crime Rates
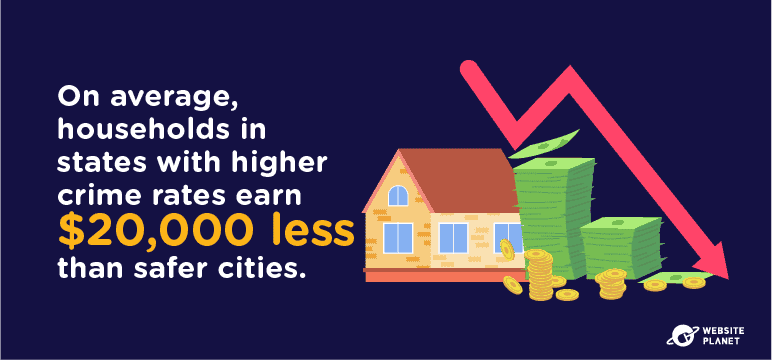
The link between crime rates and income is evident. US cities with higher crime rates typically have a much lower income than safer cities.
On average, households in cities with higher crime rates earn $20,000 less than safer cities. For example, in Shreveport-Bossier City in Los Angeles, the median income is around $47,400, and the crime rate is 5.63 per 1,000 people.
By comparison, Hopkinton in Massachusetts has a crime rate of just 1.61 per 1,000 people. The average income is also much higher, with most households earning at least $190,000 per year.
11. People Are Less Qualified Compared to Safer Cities

As well as lower incomes, people in more dangerous cities are less qualified.
The most dangerous metros have 2.5% fewer high school graduates than most US cities. While in safer cities, over 92% of people have a high school diploma or higher.
On average, states with higher crime and less-educated inhabitants also have lower literacy rates. California is one of the US’ most dangerous states, with only 76.9% of the population able to read and write sufficiently. But in New Hampshire, where income and attainment are higher, over 94% of inhabitants have sufficient literacy levels.
12. Dangerous Cities Have Higher Unemployment Rates
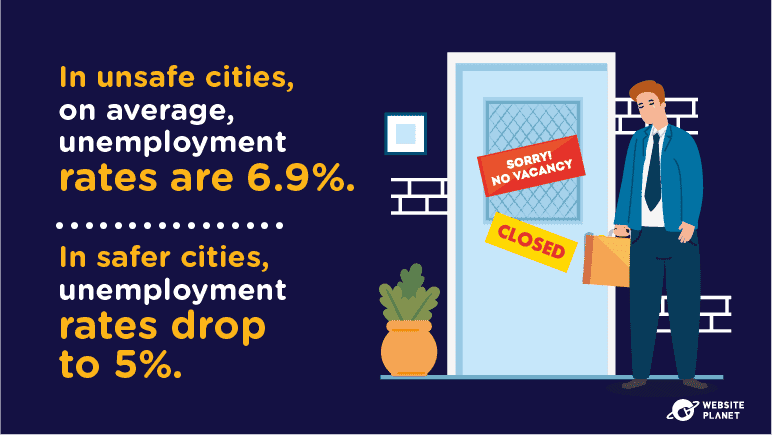
Unemployment rates in the US are rising, though they’re much higher in more dangerous metros.
The cities with the highest rates of violent and property crime have, on average, an unemployment rate of 6.9%. Bakersfield in California has the highest unemployment rate of all dangerous cities, with 10.8% of all inhabitants unemployed.
On the other hand, safer cities only have an unemployment rate of 5%, which is nearly 2 percentage points lower.
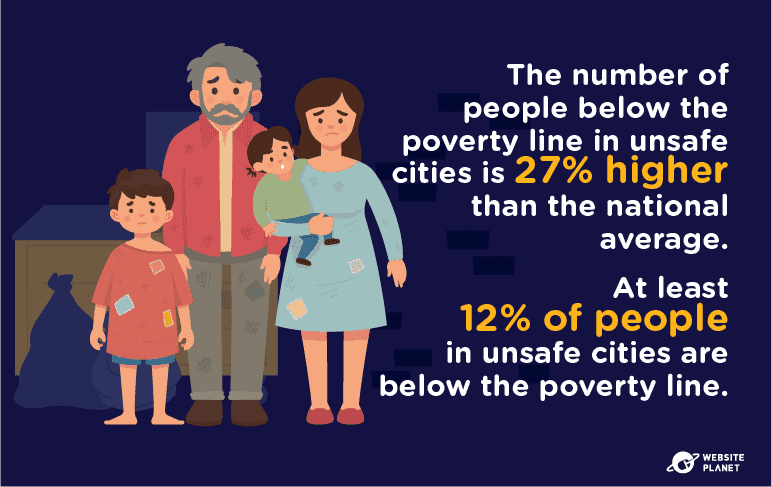
13. Dangerous Cities Are Closer to the Poverty Line
In safer cities, the number of people below the poverty line is 29% lower than the total US average.
However, the story is very different in dangerous cities with higher crime rates and lower incomes. In total, the number of people below the poverty line is 27% higher than the US average.
Most of the US’ dangerous cities have at least 12% of inhabitants below the poverty line. It’s highest in Detroit in Michigan, with over 35% of people classed as in poverty.
14. Dangerous Cities Spend Less on Community Services & Public Safety
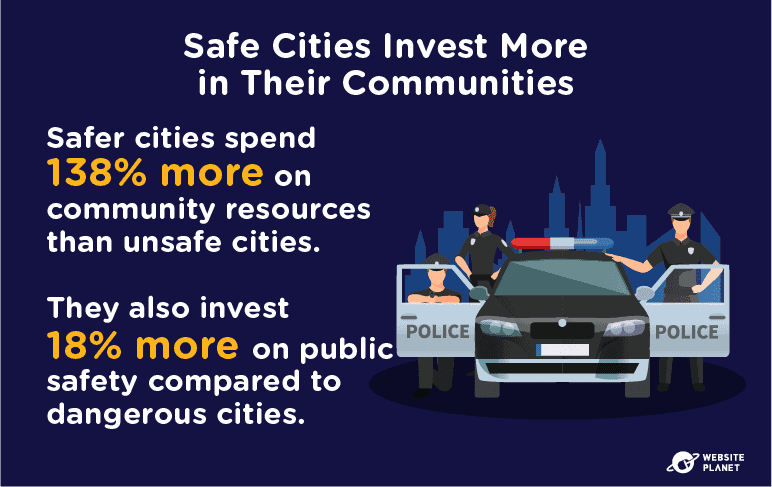
Safer cities invest much more funding into community services and public safety than in dangerous cities.
On average, safer cities spend 138% more on community services and 18% more on public safety.
In Naples-Marco Island in Florida, one of the US’ safer cities, over 34% of funding is allocated to public safety and 24.1% for community resources. But in Lubbock in Texas, only 18% of funding is spent on both public safety and community resources combined.
15. Safer Cities Are Less Densely Populated
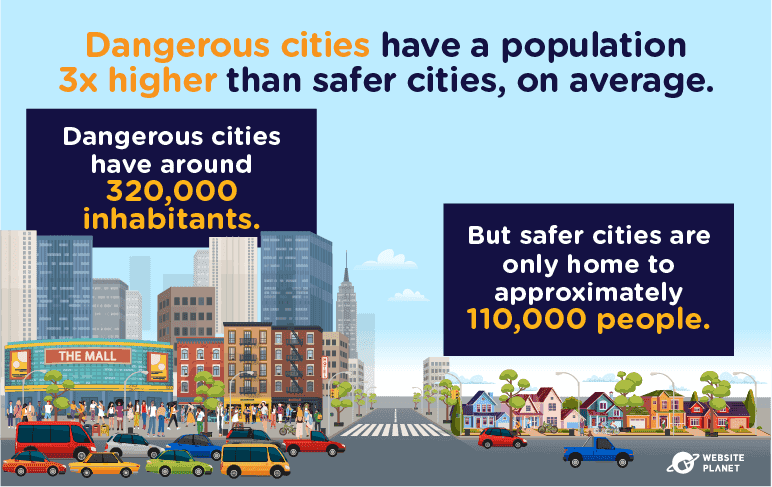
Typically, cities with fewer inhabitants are safer than larger cities. In the US, the average population of a more dangerous city is 3 times higher than a safer city.
On average, the unsafest cities house a population of around 320,000, while the safest cities only have 110,000 people. Most safe cities are also much more suburban, with greater distance between houses and smaller communities.
16. Dangerous Cities Are Linked to Drug Abuse
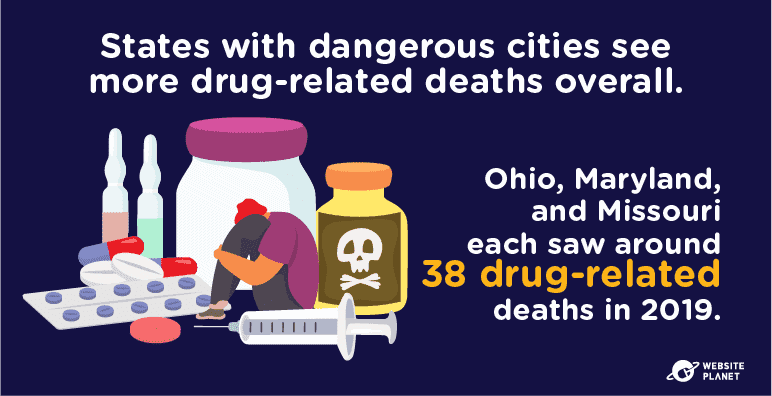
Safer cities generally have much lower crime rates and fewer socio-economic influences, including drugs. There is a stark difference in the number of drug-related deaths across the US’ most dangerous cities compared to safer areas.
Ohio, Maryland, and Missouri are home to some of the US’ most unsafe cities and have some of the highest drug-related deaths. Each state saw around 38 drug-related deaths in 2019. Yet in New York, where some of the top safest cities are, this figure dropped by nearly 50% to 18 deaths.
17. Safer Cities Are Located in the North East
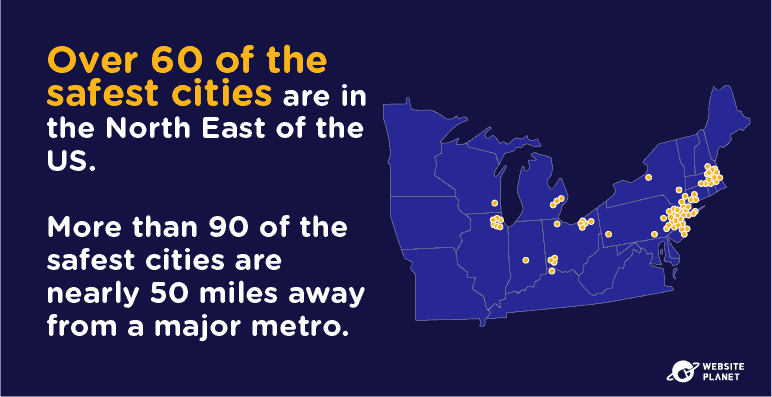
Most safer cities are located in the North East of the US, where more suburbs are found. Generally, the further away a city is from a major metropolitan area, the safer it is — likely due to a smaller population, increased income, bigger homes, and other key demographics.
Over 90 of the top 100 safest cities are located nearly 50 miles away from a major metropolitan area. And over 60 of those are in the North East.
18. 5 States Have the Highest Number of Safer Cities
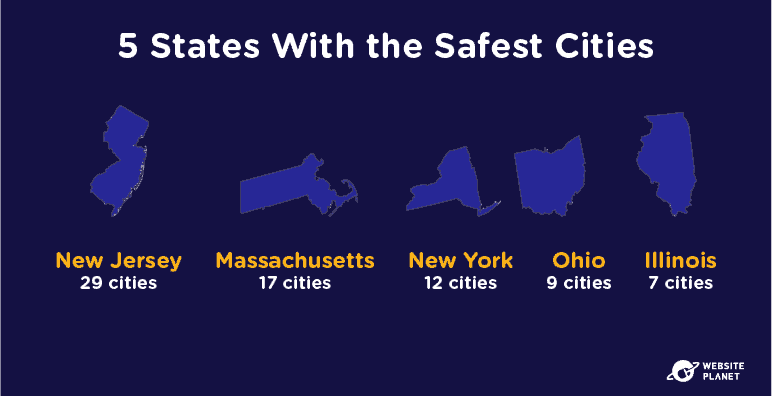
Some states have a higher number of safer cities than others. New Jersey comes first with 29 of the safest recorded cities, closely followed by Massachusetts with 17 safe cities.
Ohio, New York, and Illinois also have a higher number of safer cities, with 28 combined. However, all of these states still have some dangerous cities with higher crime rates.
The Top 10 Safest Cities in the US
We compared various statistical data to round up the 10 top safest cities in the US. This included: median income, property and violent crime rates, educational attainment, unemployment levels, poverty data, and overall population.
Here are the 10 safest cities that made the cut, in no particular order.
19. Hopkinton, Massachusetts
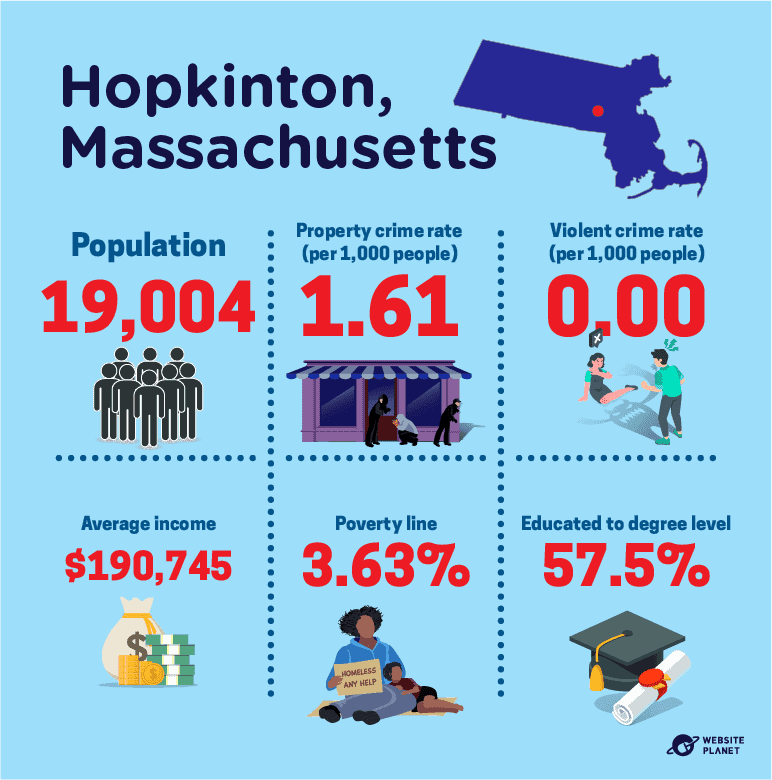
Hopkinton, Massachusetts, has one of the lowest crime rates of all the US’ safest cities. Per 1,000 people, the property crime rate in Hopkinton is just 1.61, while the violent crime rate is zero.
Typical of safer cities, Hopkinton has a smaller population, with just 19,004 inhabitants in total. The median income across households is also high at around $190,745, with only 3% falling below the poverty line.
Most of the population has high educational attainment, with over 57% of people holding a Bachelor’s degree or higher.
20. Franklin, Massachusetts
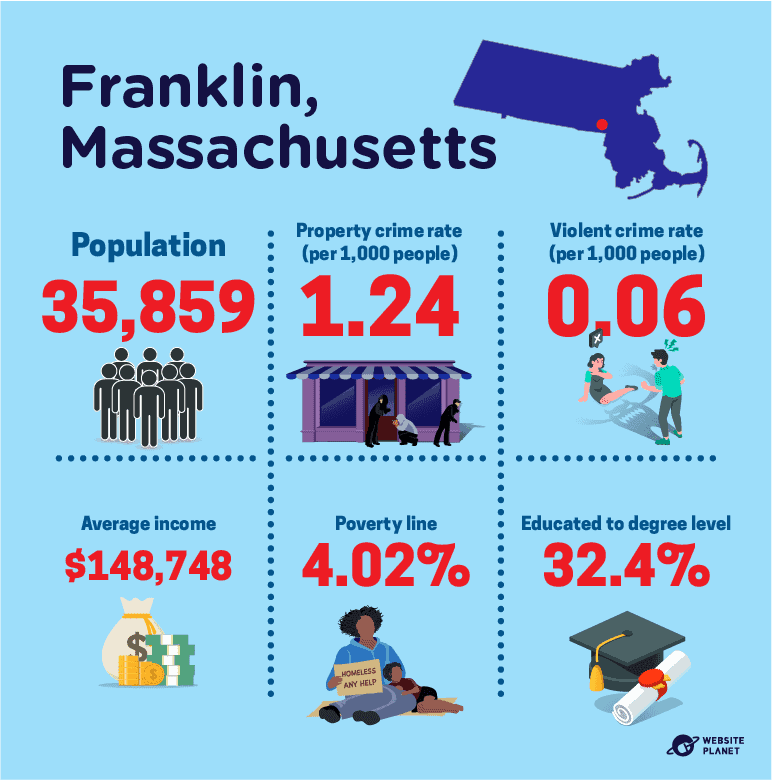
Massachusetts is home to more safer cities, with Franklin climbing the ranks in recent years. Franklin has a population of 35,859 and has slightly higher violent and property crime rates, though it’s still considered a very safe city.
Per 1,000 people, the violent crime rate in Franklin is 0.06, and the property crime rate is just 1.24. The poverty rate is also low, with only 4% of inhabitants classed below the poverty line.
On average, over 32% of the population hold a Bachelor’s degree or higher. And overall, most households bring in at least $148,000 per year.
21. Rockingham County, New Hampshire
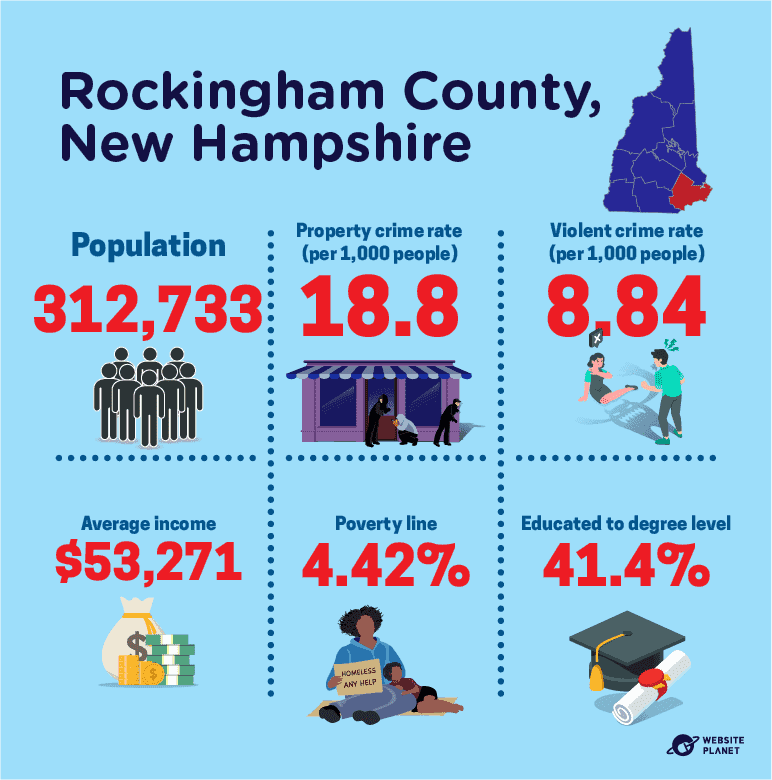
Rockingham County, New Hampshire, is one of the bigger, safe metro cities. It has a large population of 312,733, with an average growth rate of 0.48% year on year.
The average household earns a fair amount less than the first 2 cities, but still at least $53,271 per year. And at least 41% of people hold a degree in Rockingham County.
Crime rates are low, as are poverty rates. In this state, just 4.42% of people fall below the poverty line, despite a relatively smaller average income.
The violent crime rate sits at 8.84, while the property crime rate is slightly higher at 18.8 per 1,000 people.
22. Buckingham Township, Pennsylvania
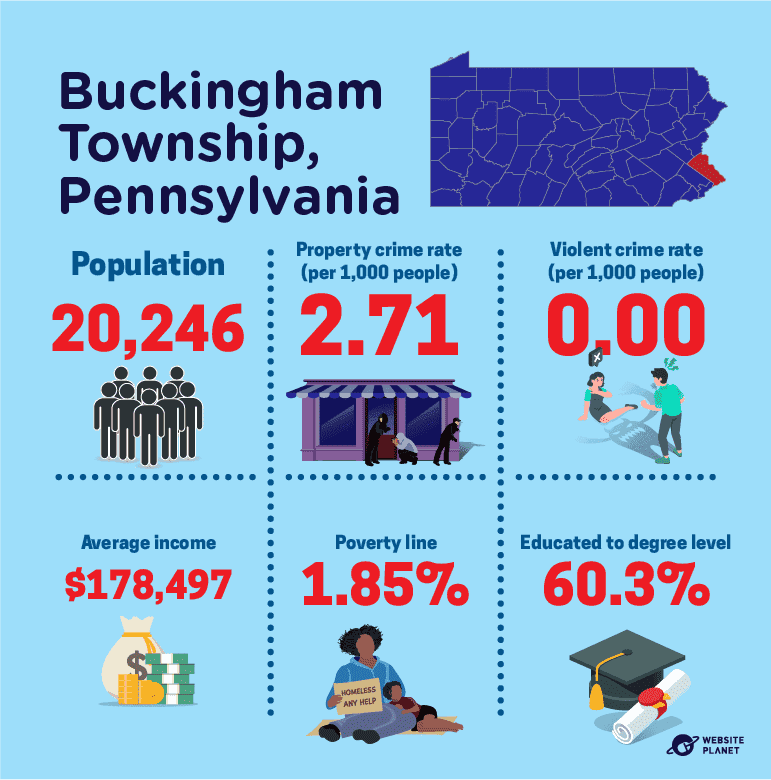
Buckingham Township in Pennsylvania has one of the lowest poverty line rates of any of the safer cities, at just 1.85%. It also has a tiny population, with just 20,000 residents.
Most households earn at least $178,000 per year, and 60% of people are educated to degree level or higher.
Crime rates have stayed low for many years. The violent crime rate remains at zero, and the property crime rate is just 2.71 per 1,000 people.
23. Oakland Township, Michigan
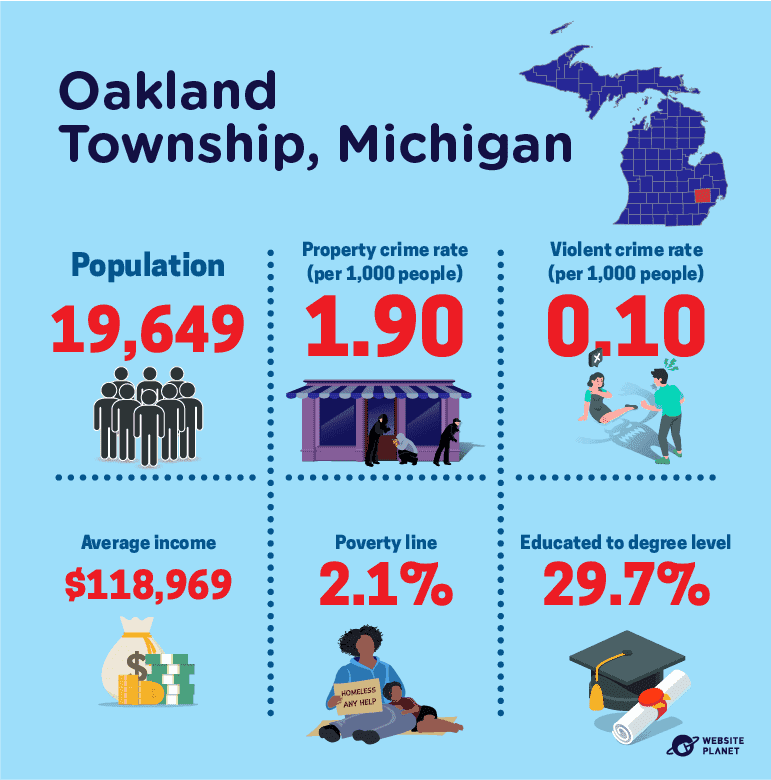
With a population of just 19,649, Oakland is a small but safe city. On average, households earn around $118,969 per year.
The violent crime rate is 0.10, gradually decreasing over recent years. Property crime rates have also steadily decreased from 3.0 in 2019 to 1.90 in 2021.
Around 29% of inhabitants hold a Bachelor’s degree, significantly lower than other safe cities.
The percentage of individuals falling below the poverty line remains low at 2.1%.
24. Bernardsville, New Jersey
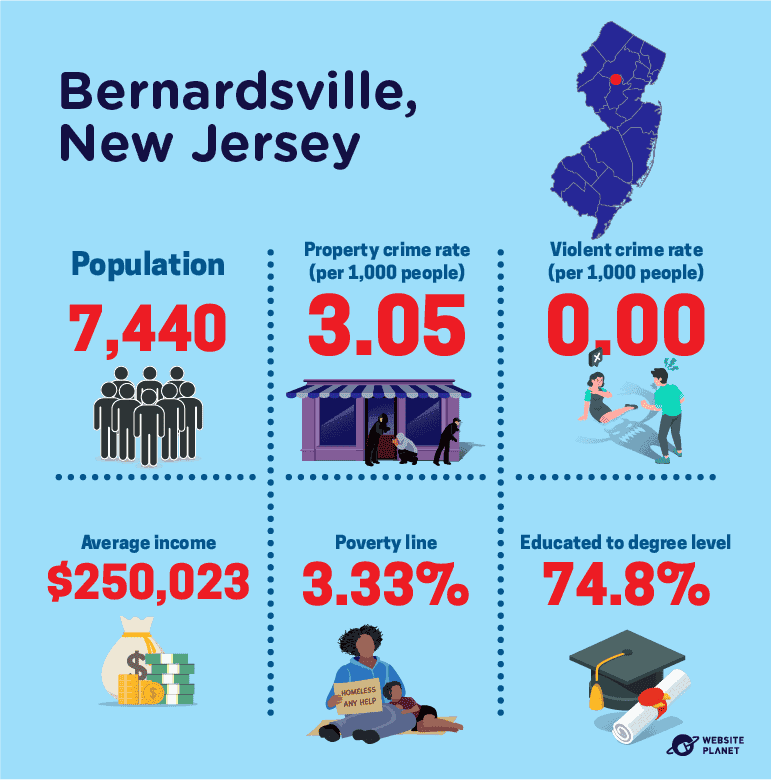
As one of the smallest safer metros, Bernardsville in New Jersey is home to just 7,440 people.
While most safer cities are growing in size, Bernardsville has actually seen a steady decline over the last few years, at a rate of around 1% annually.
Households earn, on average, around $250,023 per year, which is one of the highest of any of the safest cities. This also coincides with the fact that over 70% of individuals are educated with a Bachelor’s degree or higher. So, they’re likely in much higher paid, well-qualified jobs.
Property crime rates are around 3.05, but the violent crime rate is zero. And the number of people below the poverty line is just over 3%.
25. New Cassel, New York
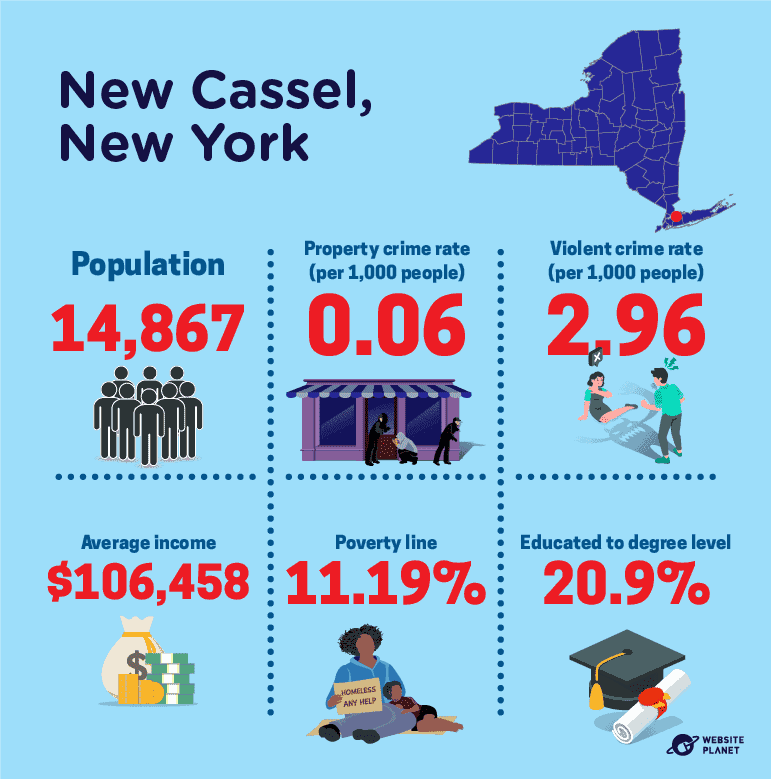
New Cassel in New York is home to 14,800 people and is one of New York’s smallest cities. The average household earns inhabitants, but the poverty rate is still relatively high compared to other safer cities, at 11%.
In New Cassel, property crime is around 2.96, while violent crime rates are much lower at 0.06 per 1,000 people.
In general, New Cassel’s inhabitants have lower educational attainment than many other cities, with only 20% holding a Bachelor’s degree or higher. That said, less than 5% are out of education entirely.
26. Sparta Township, New Jersey
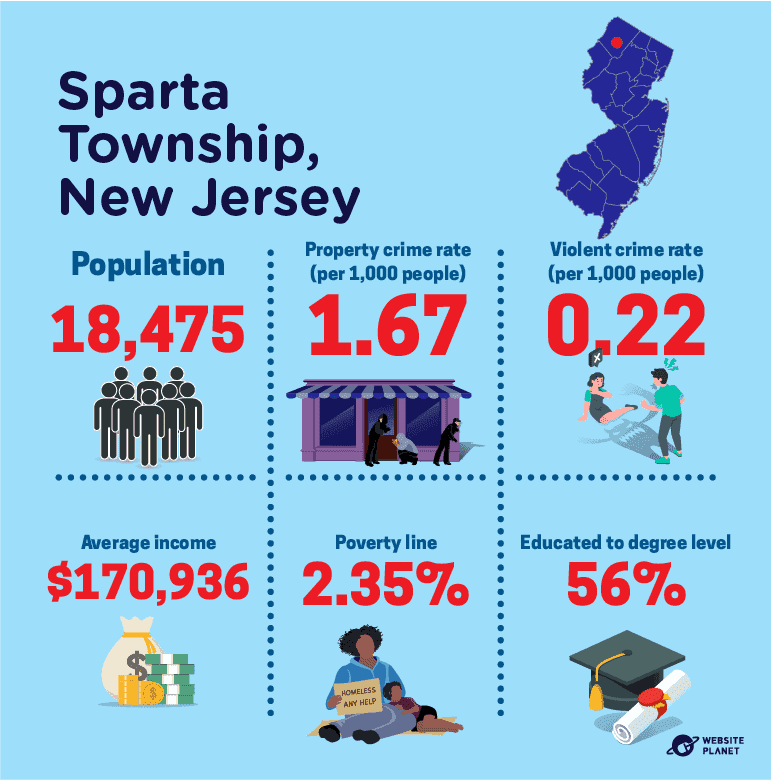
The population in Sparta, New Jersey, has rapidly declined in the last decade, though over 18,000 people still call Sparta home.
On average, Sparta has a property crime rate of 1.67 and a violent crime rate of 0.22, showing that crime is not the main reason people are leaving the city.
The poverty rate has stayed low at 2.35%. Most households earn at least $170,936 annually, with around 56% of habitants educated to Bachelor’s degree level or higher.
27. Ridgefield, Connecticut
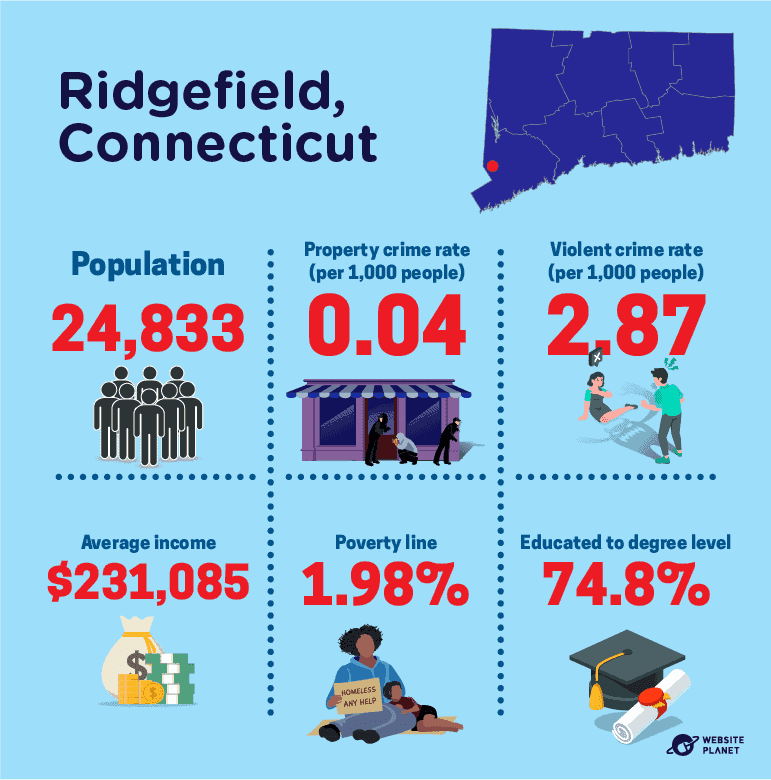
Ridgefield in Connecticut is home to around 24,000 people. The average household earns at least $231,000 per year, making it one of the highest-earning safer cities in the US.
Most of Ridgefield’s population holds a Bachelor’s degree. In fact, over 74% are qualified to this level. Only 1.7% are out of education altogether.
The number of people below the poverty line is also very low, at just 1.98%. So too are the violent crime rates, with around 0.04 offenders.
Property crime rates are slightly higher, however. On average, Ridgefield sees 2.87 property crimes for every 1,000 people.
28. Hamburg Township, Michigan
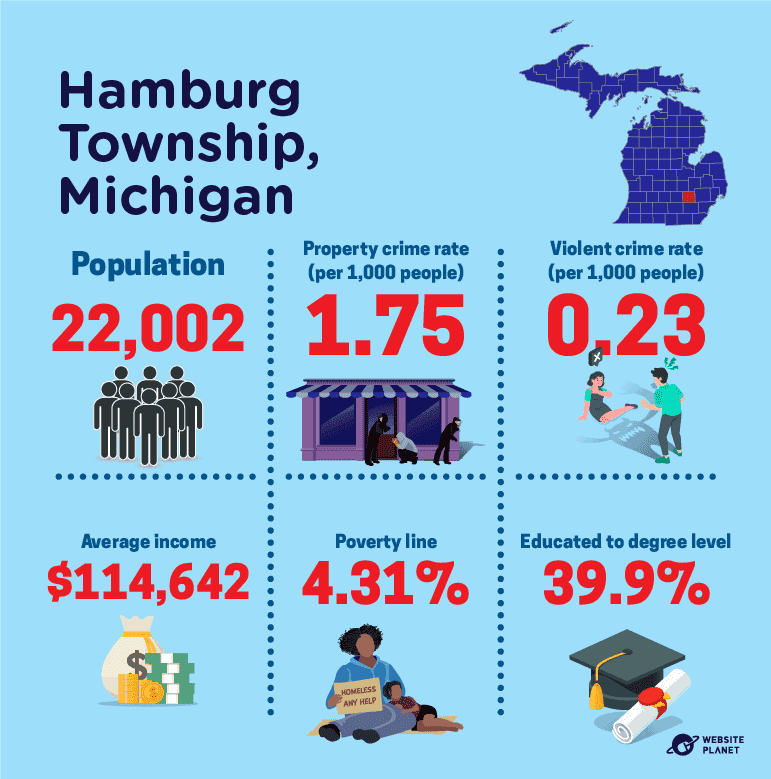
Hamburg Township in Michigan is a growing city, with over 22,000 habitants.
However, the poverty rate is higher than most other safe cities, with 4.31% of people falling below the poverty line.
Households earn around $114,642 per year on average, and approximately 36% of people have a high level of educational attainment.
Despite it being one of the lower-earning cities, it’s fast growing in popularity with more and more people moving to the city every year. It has one of the fastest growing populations of all safer cities, seeing a 4% increase since 2020.
As with other safer cities, the crime rates are low. On average, there are 0.23 violent crimes and 1.75 property crimes per 1,000 people.
The Top 10 Least Safe Cities in the US
We used the same methodology to determine the least safe cities. Looking at violent and property crime rates, average household income, poverty lines, educational attainment, overall population, and other key statistical data, here are the US’ most dangerous cities right now, in no particular order.
29. Anchorage, Alaska
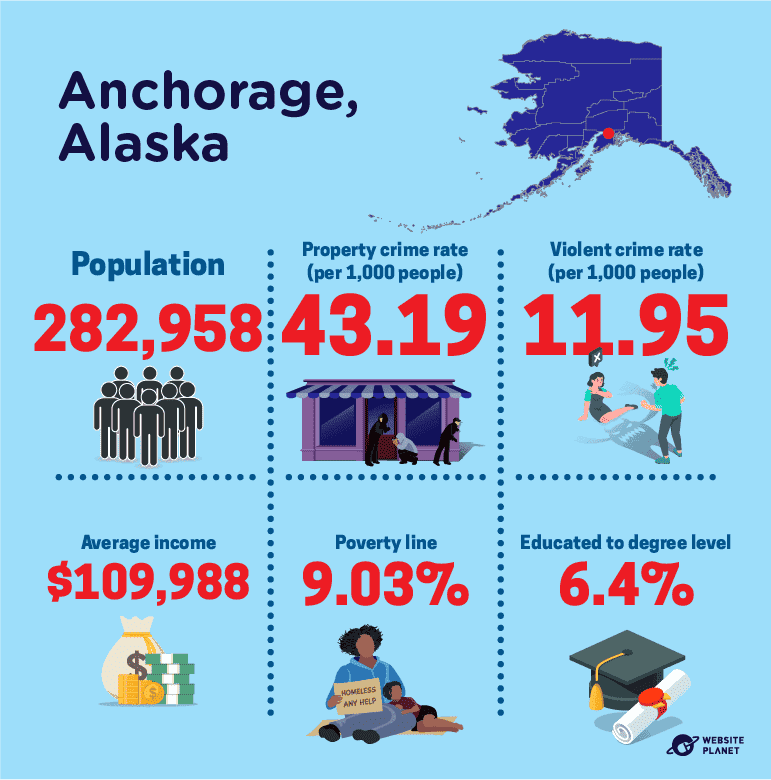
Anchorage is the largest city in Alaska, with a population of around 280,000. The population is, however, rapidly decreasing. In the last decade, Alaska has lost over 4% of its inhabitants.
Violent crime rates are high at 11.95 per 1,000 people. Property crime rates are even higher, with around 43.19 offenders.
On average, households earn $109,988 per year, though the percentage of people below the poverty line is high at 9.03%.
Anchorage also has a high unemployment rate of 6.4%, much higher than the US average of 5.2%.
30. Memphis, Tennessee
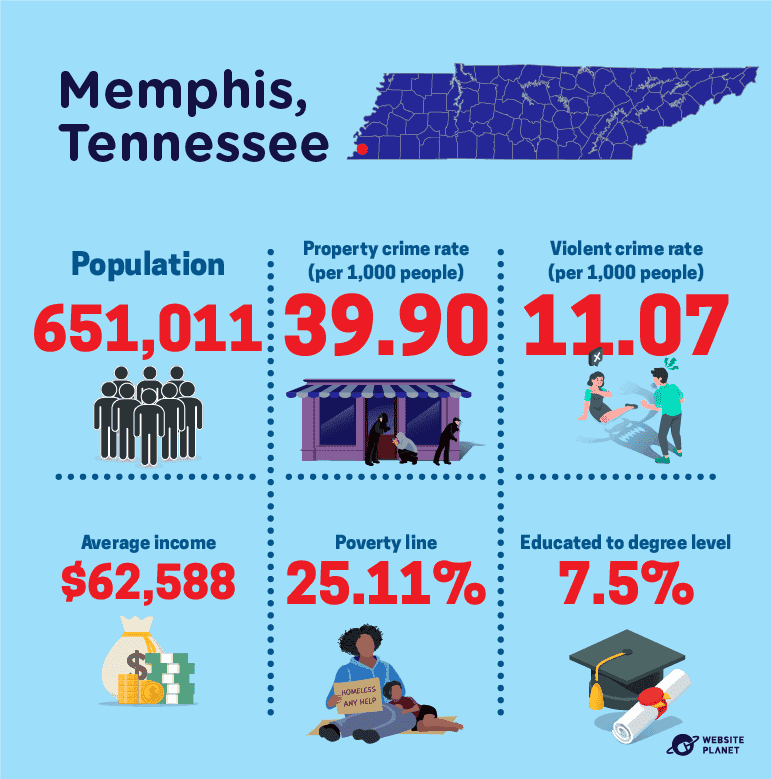
Memphis in Tennessee is one of the largest unsafe cities, with a population of 651,011. It’s actually the 28th largest city in the whole of the US.
In Memphis, around 25.11% of people live below the poverty line, and a further 7.5% are unemployed.
Households in this city earn much less than others. The median household income is $62,588, the lowest of all dangerous cities. Though some of the safer cities still bring in less than this per year.
Memphis holds some of the highest crime levels, too. The average violent crime rate is 11.07, and property crime is higher at 39.90.
31. Lubbock, Texas
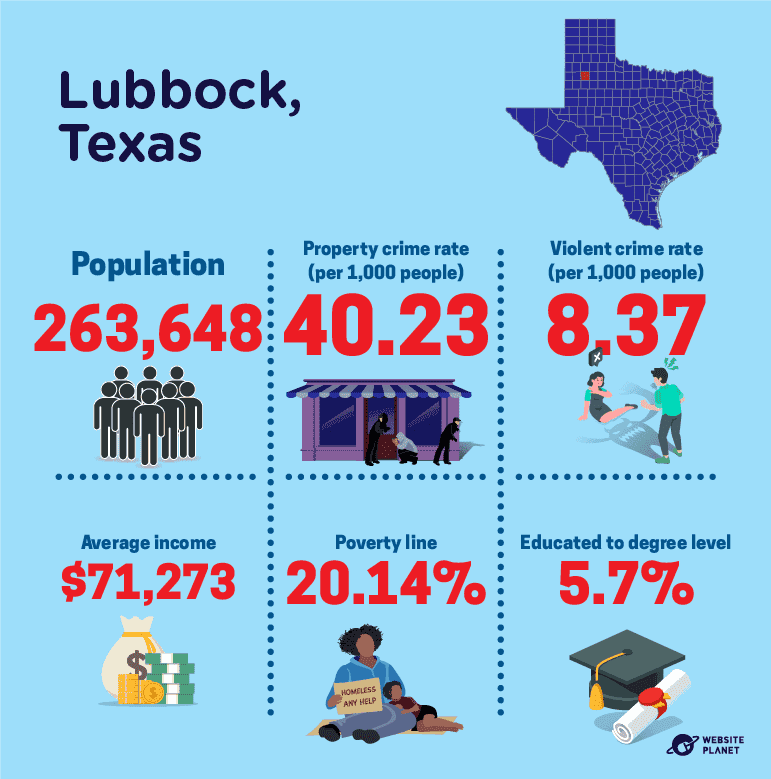
Although Texas has many safe cities, it’s also home to some of the most dangerous. Lubbock has a rapidly growing population, seeing an increase of over 14% since 2010.
Currently, over 260,000 people live in Lubbock, though over 20% of these also live below the poverty line.
Average incomes across households total $71,273, with an unemployment rate of 5.7%.
Lubbock experiences its fair share of crime. Per 1,000 people, there are 8.37 violent crimes and 40.23 property crimes on average.
32. Detroit, Michigan
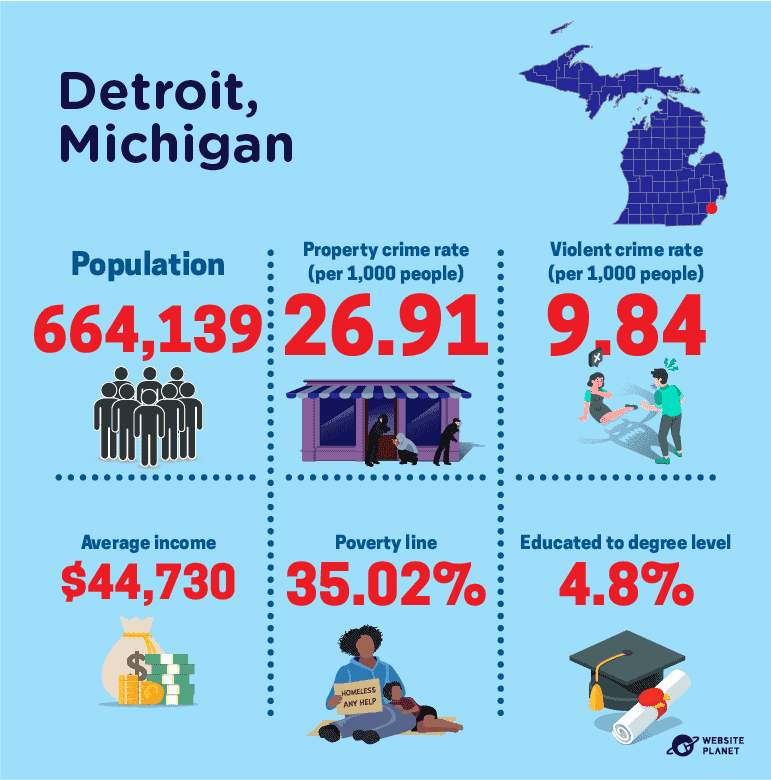
Detroit holds the largest population of all the US’ unsafest cities. It’s home to 664,139 people, but this is declining by 0.44% annually.
Crime rates are high, with around 9.84 violent crimes and 26.91 property crimes per 1,000 people.
Households in Detroit earn around $44,000 per year, the lowest of all the US’ most dangerous cities. However, the unemployment rates aren’t as high as other metros, with 4.5% of people unemployed. This is actually lower than the US average of 5.2%.
The number of people below the poverty line is extremely high, though. Around 35% of people suffer from poverty in Detroit.
33. Baltimore, Maryland
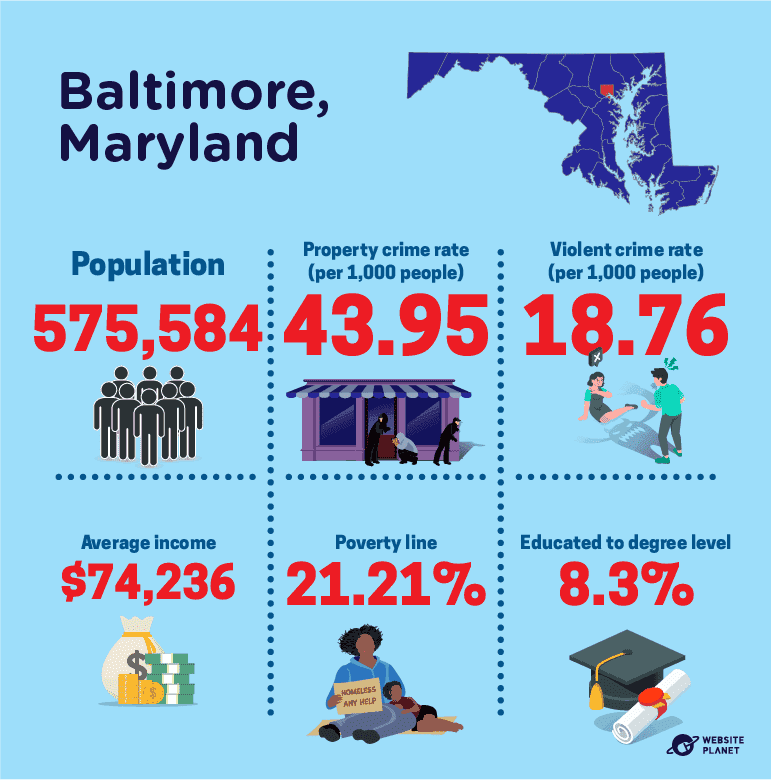
Baltimore in Maryland is home to 575,584 people, which averages 7,111 people per square mile. It’s a densely populated city with a high poverty rate of 21.21%.
Most households earn around $74,246 per year, with an unemployment rate of 8.3%. Over 3 percentage points higher than the national average.
In total, Baltimore experiences 62 crimes per 1,000 people. This equates to 18.76 violent crimes and 43.95 property crimes.
34. Cleveland, Ohio
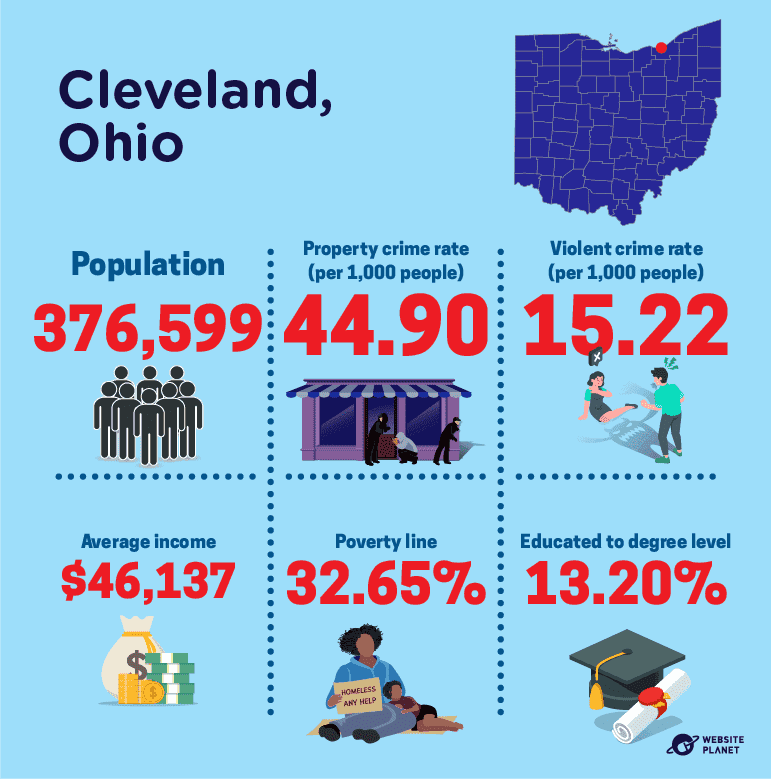
Cleveland is the second largest city in Ohio. While Ohio is one of the US’ safest states, Cleveland is actually one of the most dangerous cities in the US.
Around 376,599 people live in Ohio. It has one of the highest poverty rates of 32.65%, and an extremely high unemployment rate at 13.20%.
The average income in Cleveland is very low, with most households earning $46,137 per year.
It also holds the record for some of the highest crime rates. On average, there are 15.22 violent crimes and 44.90 property crimes for every 1,000 residents.
35. St. Louis, Missouri
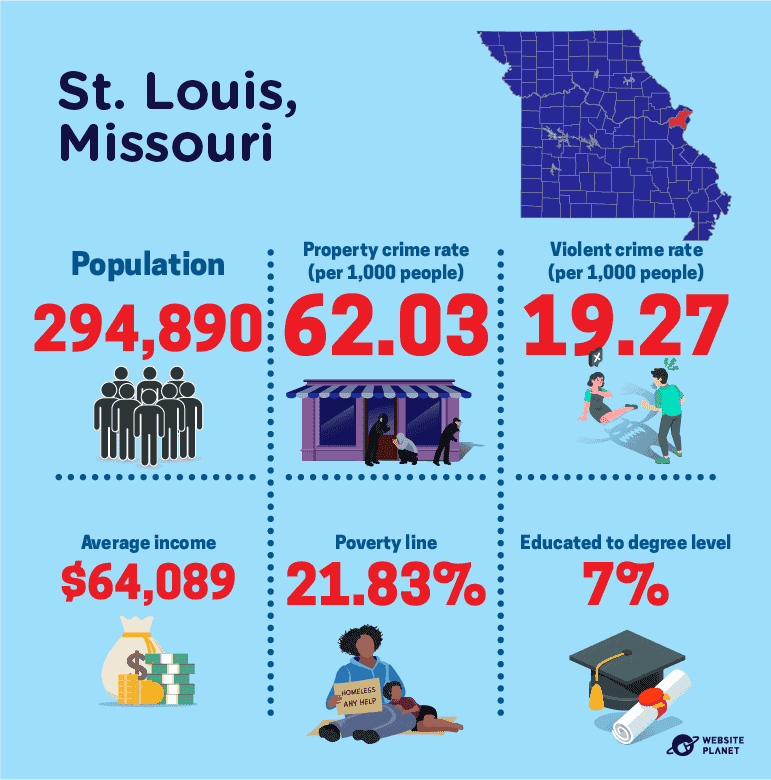
In St. Louis, the chances of falling victim to violent crime are 1 in 52, with around 19 violent crimes per 1,000 people.
Property crime rates are much higher, at 62.03. St. Louis actually holds the record for one of the highest property crime rates of all states in the US.
Around 294,890 people live in St. Louis, and 21.83% live below the poverty line.
Surprisingly, households bring in more income than many other unsafe cities. The median income is $64,089, with an unemployment rate of 7%.
36. Kansas City, Missouri

Kansas City is the largest city in Missouri, and one of the state’s most dangerous metros. Around 501,957 people live in Kansas City, and it’s growing year on year.
Crime rates are lower than some other dangerous cities but remain high. In Kansas City, violent crime rates stand at 14.34, and property crime rates are 38.85 per 1,000 residents.
Average household incomes top $75,000, with an unemployment level of 4.8%, more surprising. Around 16.10% of the population in Kansas City fall below the poverty line.
37. Springfield, Missouri
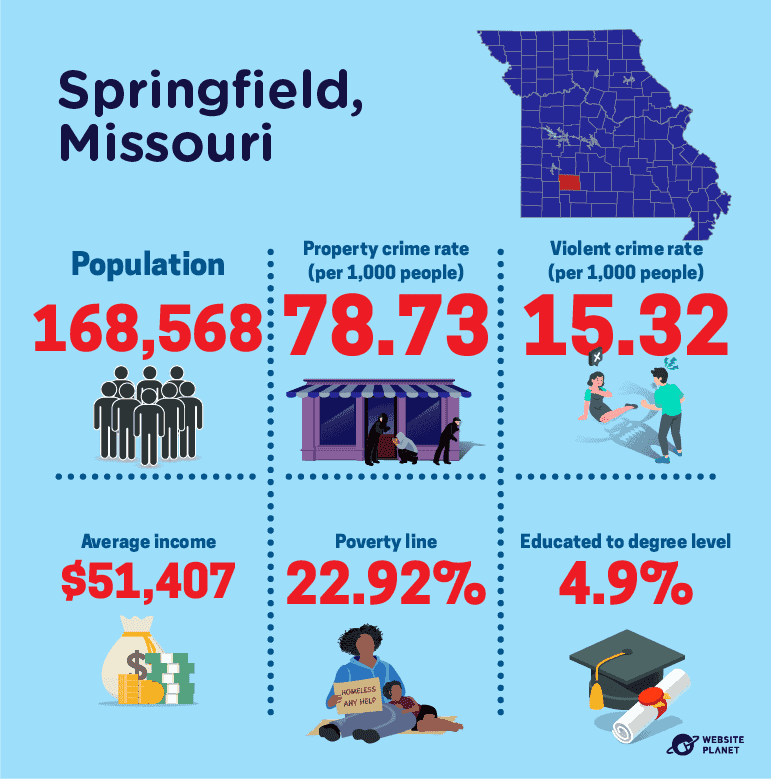
Missouri is home to another city in the top 10 most dangerous US cities — Springfield.
Compared to other dangerous cities, Springfield has a fairly small population of 168,568 people. However, the amount of people below the poverty line remains high at 22.92%.
It has the highest property crime rates of all unsafe metros, with 78.73 property offenses per 1,000 people. Violent crime rates are lower, though still high at 15.32 offenses.
On average, households earn $51,407 per year, with an unemployment rate of 4.9%.
38. Bakersfield, California
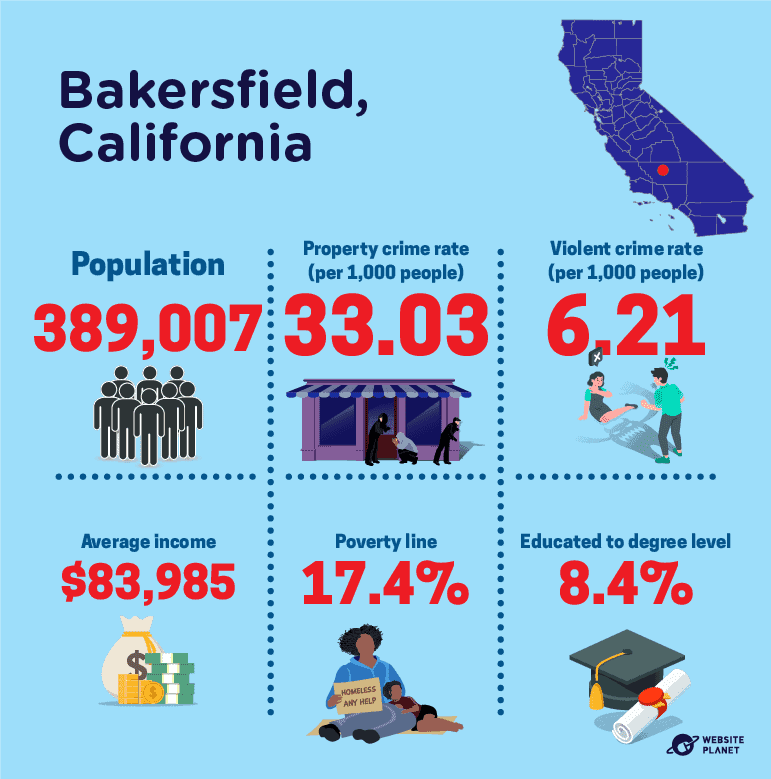
Bakersfield in California has 389,007 residents, which is gradually increasing.
On average, households earn $83,985 per year, with a poverty rate of 17.4%, and an unemployment level of 8.4%.
Although it’s one of the higher-earning dangerous cities, it has one of the lowest populations of adults with high levels of attainment, with just 23% of people holding a Bachelor’s degree.
Violent crime rates are currently 6.21, and property crime rates are much higher at 33.03 per 1,000 people.
The Perception of Safety in the US
Statistics show how crime has declined year on year, but perceptions of safety across the US don’t always align with the facts. Actually, many Americans think crime is getting even worse and are more fearful for their safety than ever.
39. Americans Believe Crime Is Worsening
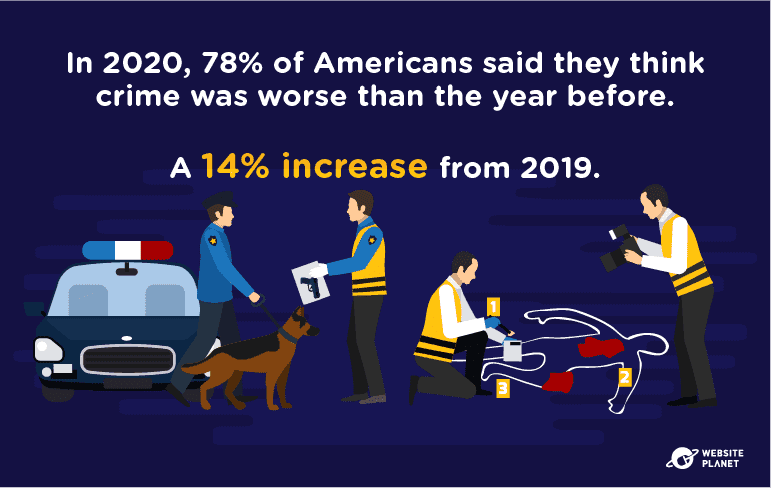
Although crime has actually decreased year-on-year in the US, not everyone thinks so.
In fact, in 2020, 78% of Americans said they believe there was more crime than the year before. This was up from 64% in 2019. Only 12% said they thought there was less crime than in 2019.
40. Certain Crimes Create More Fear Than Others
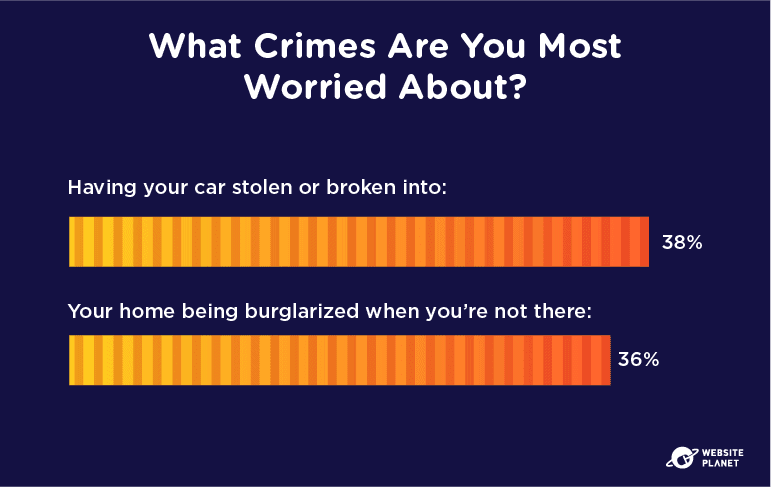
Many US residents are more worried about certain crimes than others.
Having their car stolen or broken into is one of the most common crimes Americans fear, with 38% stating this as their top concern. 36% of Americans also identified their home being broken into as another crime they were most fearful of.
However, of all crimes, people in the US are most concerned about cybercrime and identity theft. In fact, more than 65% of people said they worry most about having their identity or personal information stolen online.
41. People Feel Safer in Different States
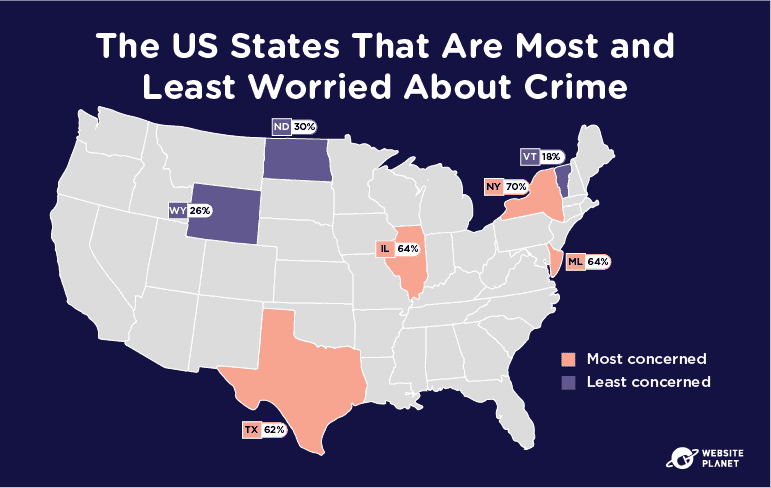
With some states and cities more dangerous than others, it’s no wonder that Americans feel safer in certain areas. However, the perception of safety in some states is more surprising than in others.
New York, for example, is home to 12 of the safest cities in the US, yet 70% of the population are worried about their safety on a daily basis. This was the highest percentage of all areas surveyed.
Texas, Illinois, and Maryland were also among the most concerned states. In contrast, people in Vermont, Wyoming, and North Dakota are the least worried about their safety, with as little as 18% of people stating this as a concern.
42. Demographics Affect Crime Perception
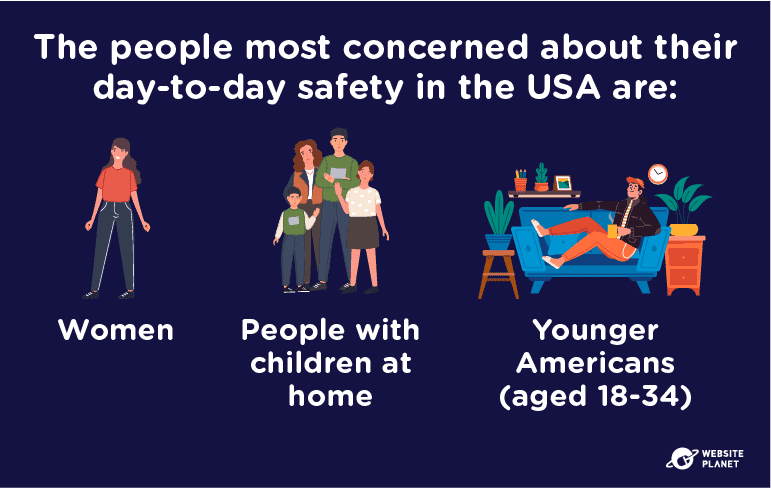
Even though all Americans are clearly worried about their safety and the state of crime in the US, demographics have a part to play in how fearful people are.
Women, households with children, and younger individuals (aged 18-34) were the most concerned about their day-to-day safety. In fact, women and those aged 18-34 were most likely to carry pepper spray or a gun as a method of personal safety.
43. Violent Crime Experiences Are Increasing
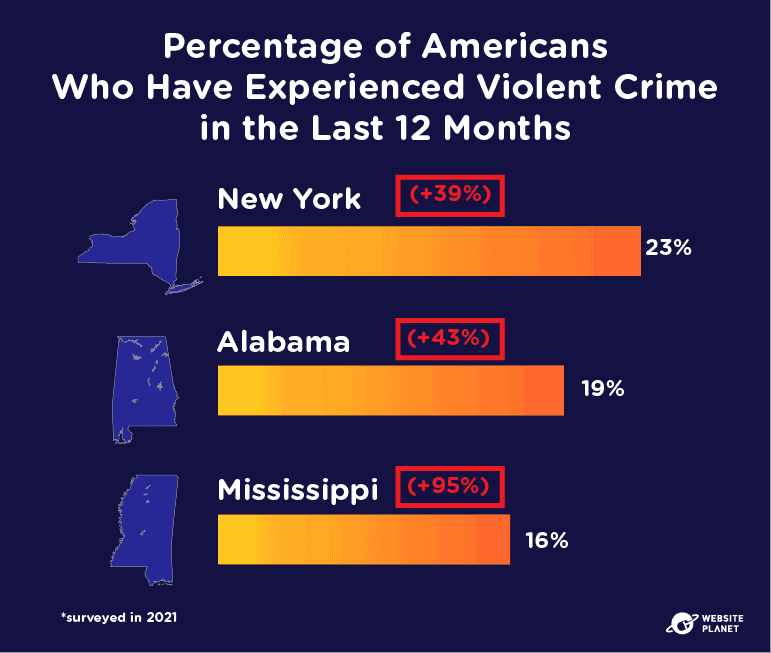
Personal experiences of violent crime are increasing throughout the US, despite overall crime levels steadily declining annually.
New York, Alabama, and Mississippi were the top 3 states with the highest reports of violent crime. In New York, over 20% of people said they have personally experienced violent crime in the last 12 months, increasing 39% from the year before.
This isn’t the case across all states, though. For example, in New Hampshire, 0% of people said they had experienced violent crime in 2021 — a decrease of 17% from 2020.
44. And Property Crime Incidents Are Too
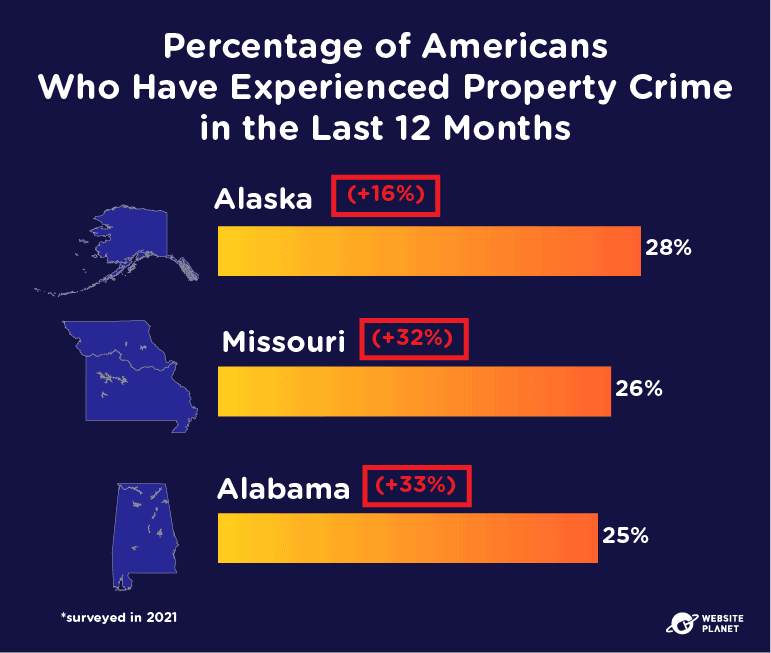
Experiences of property crime have also climbed in the last 12 months, particularly in Alaska, where 28% said they had fallen victim to property crime.
Missouri (26%) and Alabama (25%) were also among the top 3 states with the highest reports of property crime.
As with violent crime, however, experiences of property crime have also decreased in some states. New Hampshire saw the largest decrease of all states in the past year, with a 16% decline.
45. Gun Violence Is a Top Concern
In 2020, reports of gun violence hit a record high. In fact, more people than ever now say they can regularly hear gunshots from their home.
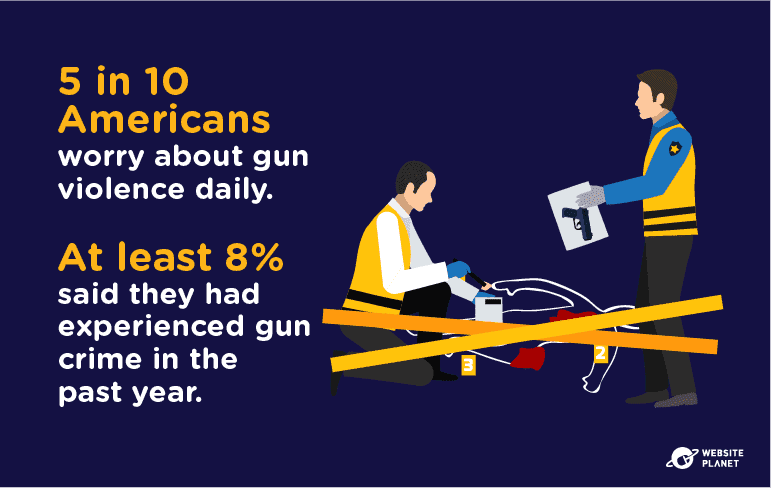
Around 5 in 10 Americans say they worry about gun crime on a daily basis. And at least 8% said they had experienced an act of gun violence in the past year.
The Mid-Atlantic was the most concerned region, with 55% saying they’re worried about gun violence — a stark increase from the US average of 38%.
46. COVID-19 Has Affected Perception of Crime

Many Americans believe COVID-19 has made crime rates even worse. 62% of Americans say they’re worried about COVID-19 and how it affects their day-to-day safety.
Interestingly, those regions that experienced more cases and deaths from the pandemic were also more concerned. 69% of people in the Mid-Atlantic said they were concerned about COVID-19, which was the highest across all regions. It’s home to New York, which was severely impacted by COVID-19 cases and deaths.
47. Americans Are Taking Action
With concerns around property and violent crime growing, Americans are now taking action, especially those who have personally experienced crime.
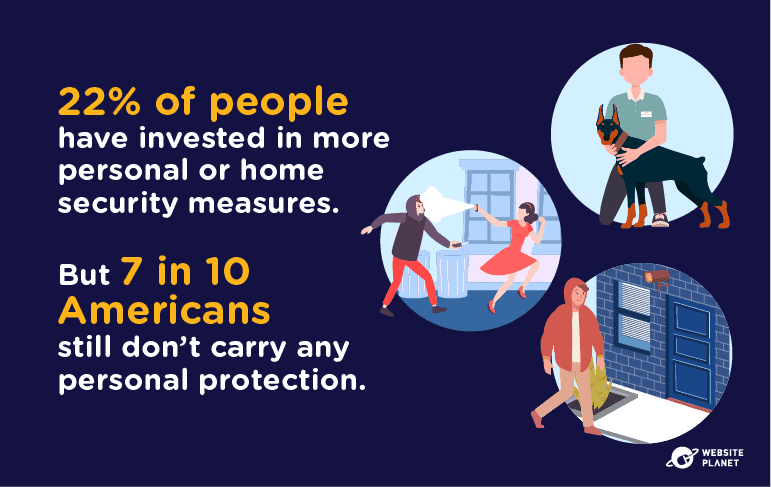
Around 22% of people have invested in more personal or home security in the last year, with security cameras and guard dogs being the most common. However, there are still many people who don’t protect themselves. Around 7 in 10 Americans don’t carry any personal protection with them.
48. The US Is Spending More on Home Security

Overall, the US is spending more money on home security than ever before. And more money than any other country in the world.
In 2018, the US generated over $5 billion in revenue in home security, showing that Americans are taking action to protect themselves and their property. China, second in line, only generated $1 billion.
The Future of Safety in the US
Trends show that crime is gradually declining in the US, but that doesn’t mean it’s gone. In fact, some crime rates are increasing. And while we’d expect people to be fleeing from dangerous cities, statistics actually tell a very different story.
49. More Crime Doesn’t Mean People Are Moving Away
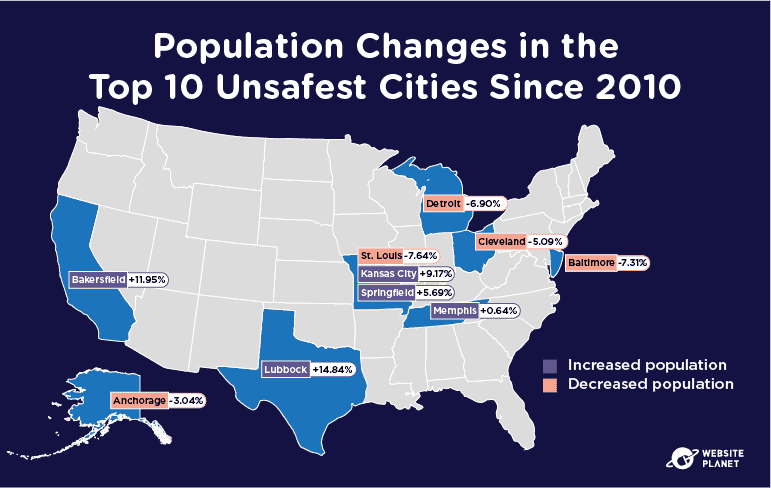
Population rates are decreasing in many unsafe cities, but they’re also increasing, too.
Bakersfield in California, for example, has seen its population rise by nearly 12% in the last decade. In fact, 50% of the top 10 unsafest cities on our list have rapidly growing populations.
Clearly, crime rates are not the only contributing factor forcing people out of cities. While people may be concerned about crime, other demographics are obviously influencing people’s decisions. Likely, people are moving out of expensive areas into cheaper, more affordable cities. Unfortunately, those cheaper areas typically come with higher crime rates.
50. Safer Cities’ Populations are Growing
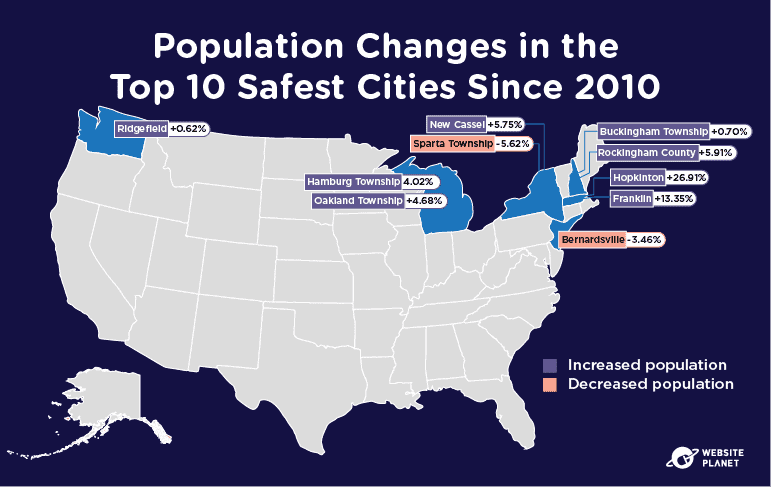
Although populations are still growing among dangerous cities, they’re rising at a much faster rate in safer towns. Hopkinton in Massachusetts saw a rise of over 26% since the last census in 2010.
Most of the safer towns on our top 10 list have all seen an increase in population. While people may not necessarily be fleeing from dangerous cities, many are opting to move to safer areas.
Only 2 cities on our list have lost residents. Bernardsville’s population has decreased by over 3%, while Sparta Township has faced a more rapid decline of 5.62%.
51. Murder Is on the Rise
The future of crime in the US is not easy to predict. However, it looks like murder cases are on the rise significantly.
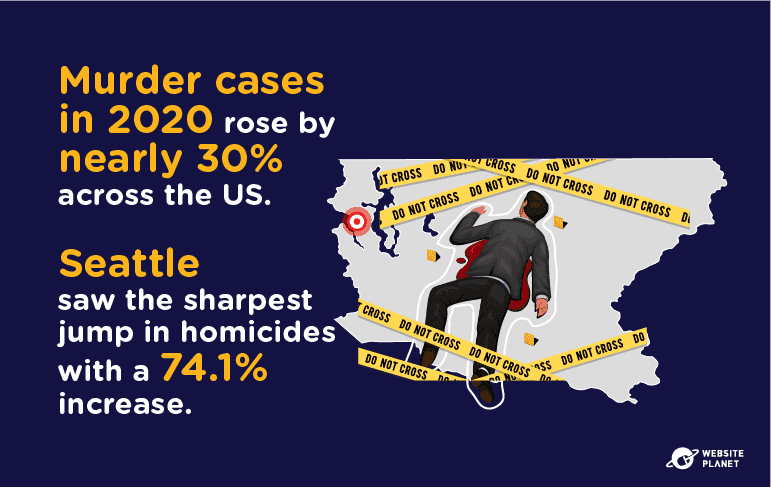
In 2020, the number of murder cases jumped by almost 30%. While the murder rate still falls about one-third below the 1990s, the sharp increase in homicides cannot be ignored.
Some states faced a worse fate than others, too. The most notable increase was in Seattle, where murder cases increased by 74.1% last year, followed by 61.7% in New Orleans.
52. Aggravated Assaults Are Increasing
Alongside murder, cases of aggravated assault look set to increase in the future based on current trends.
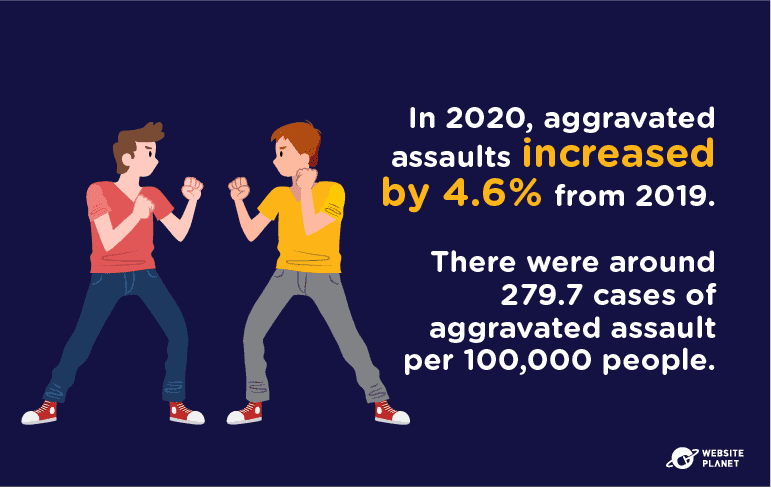
Between January and June 2020, FBI data shows an increase of 4.6% in aggravated assaults compared to the same period in 2019.
In 2019, there were around 250.9 aggravated assaults per 100,000 people, though, in 2020, this rose to 279.7. And it’s been steadily increasing since 2014.
51. And COVID-19 Is Creating More Gun Violence
Throughout the pandemic, America faced a massive increase in gun violence. And it doesn’t yet show any signs of slowing down.
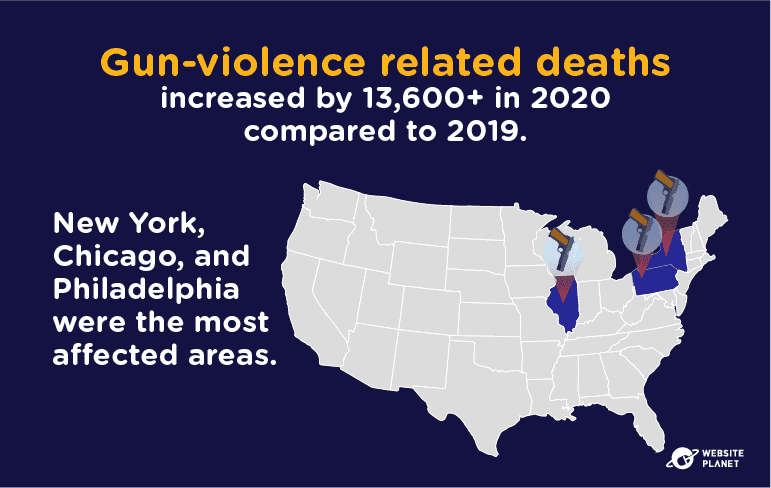
Major cities such as Chicago, New York, and Philadelphia were the most affected. In New York, the number of shootings victims rose by 99%, with a total of 753 more victims when compared to 2019.
In total, there were over 13,600 more homicides, murders, and gun-related deaths in 2020 than in the previous year.
52. Hate Crimes Growing Faster Than Ever
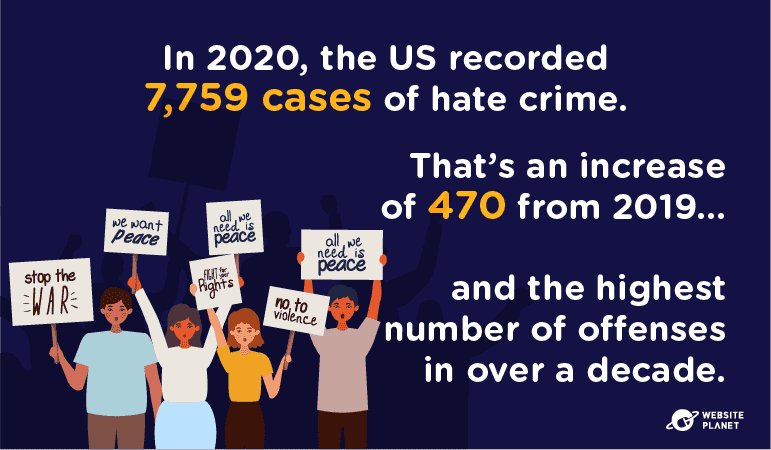
Hate crimes have been rising since 2014 and are now at the highest ever since 2007.
In 2020, the US recorded over 7,700 hate crime cases, with people being targeted for their religion, race, gender, sexuality, or disability. That’s an increase of 470 from the year before.
Among all incidents, anti-Black hate crime was the most common, with a total of 2,755 offenses. Offenses against Asians, typically due to the pandemic, also increased drastically, with a jump of 70% recorded cases. It looks like hate crime will be an ever-growing issue for the US in the future.
53. …But Overall Crime Rates Will Likely Slow Down
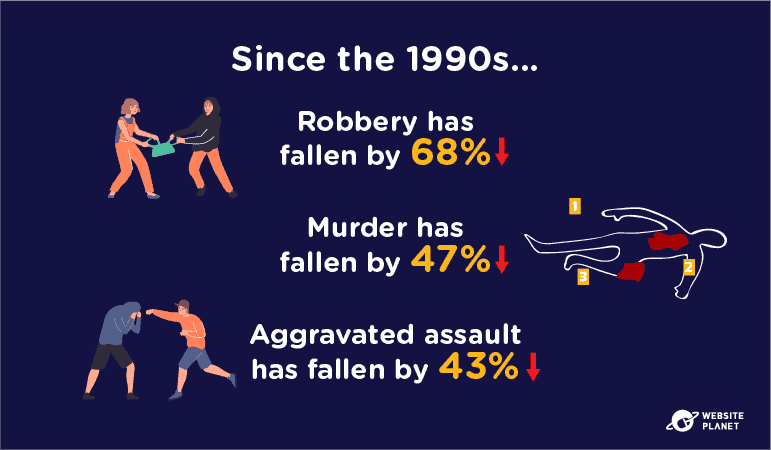
Despite many crimes rising all over the US, the actual overall crime rate is still at an all-time low compared to 2 decades ago.
Crime rates have plunged since the 1990s, particularly robbery, murder, and aggravated assault. Robbery has seen the biggest fall, with 68% fewer cases than in the 1990s. Meanwhile, murder has declined by 47%, and aggravated assault by 43%.
54. Accounts of Rape Are Declining, But Still High in Some States
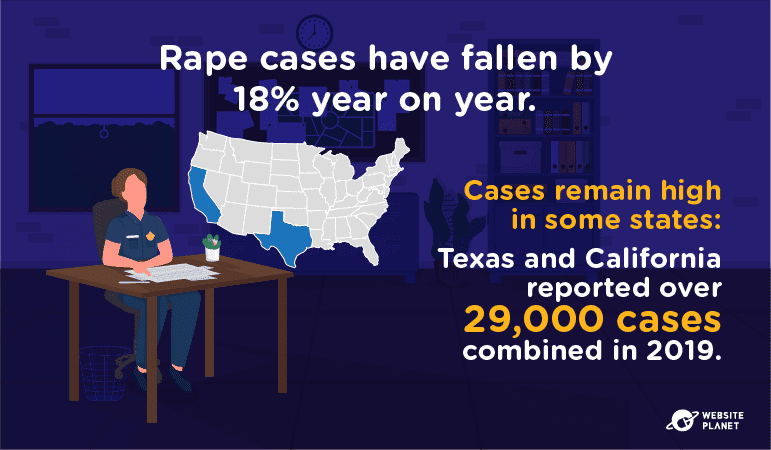
Cases of rape have also fallen by around 18% year on year, showing that the US is certainly taking steps in the right direction when it comes to tackling gender-related violence.
However, despite a sharp fall in rape cases, some US states still experience high numbers of offenses. Texas and California reported the highest number of forcible rape cases in 2019, with over 29,000 cases across both states.
By comparison, New Hampshire and Vermont saw just over 700 cases combined.
55. People Are Reporting More Violent Crime Incidents

The number of people reporting violent crime has been growing year-on-year. This likely correlates to an overall decrease in the number of crimes throughout the US.
In 2020, US residents reported over 1.3 million cases of violent crime, up from 1.2 million in 2019. Many crimes still go unreported in the US, but it’s clear more and more people are coming forward.
56. Reported Property Crimes Are Slowing Down
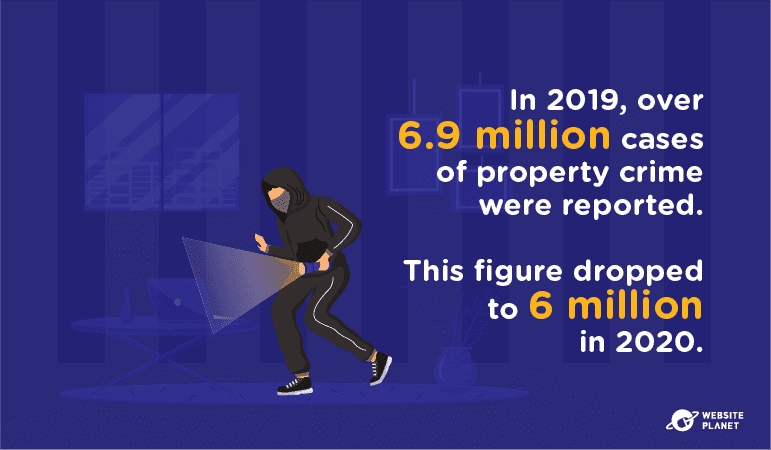
Although more people are coming forward to report cases of violent crime, the same can’t be said for property crime. Reported cases of property crime have been gradually decreasing for the last decade.
In 2020, around 6 million cases of property crime were reported, though this decreased from 6.9 million the year before.
Fewer reported cases might result from an overall decrease in the number of property crimes across the US, though it’s likely that many remain unreported. If trends continue, the US may see a spike in the number of property-related crimes — especially in the most dangerous states.
The Bottom Line
While it appears some cities experience very little crime, rates in other cities are climbing rapidly. And demographics such as population, poverty, educational attainment, and unemployment rates have a huge role to play.
It’s no surprise that densely populated cities with greater unemployment rates and more people closer to the poverty line generally experience much higher crime rates. Yet, people are still moving to these cities.
It’s clear that crime rates have plummeted compared to previous decades, but many crime rates are still increasing. Property theft, murders, and gun violence are still some of the biggest problems to date, whether you’re within one of the US’ safest cities or not.
Regardless, the US is home to some beautiful and (very) safe cities that offer idyllic places to live, despite potentially high crime rates. Crime occurs in every city, in every country in the world, and the US is no exception.